Qubit spectroscopy: CZ Ramsey measurement example
Similar to a \(T_2^*\) Ramsey experiment, a CZ Ramsey experiment measures fringes resulting from induced Z rotations, which can result in non-unitary CZs. To rectify this non-unitarity, we determine the correction we need to apply to each qubit in the form of RZ rotations. If a CZ is perfectly unitary (or has been compensated for adequately with RZ pulses), a CZ Ramsey experiment should return 0 radians for each qubit. If, however, some correction is required, these angles will be
non-zero.
A sample QUIL program at one data point (specified by the equatorial Z rotation which maximizes excited state visibility when equal to the required RZ correction) between qubits 0 and 1 would look like
DECLARE ro BIT[1]
DECLARE theta REAL[1]
RX(pi/2) 0
CZ 0 1
RZ(theta) 0
RX(pi/2) 0
MEASURE 0 ro[0]
Setup
[1]:
from typing import Tuple

from matplotlib import pyplot as plt
import numpy as np

from pyquil import Program
from pyquil.api import get_qc, QuantumComputer
from forest.benchmarking.qubit_spectroscopy import *
[2]:
#qc = get_qc('Aspen-1-15Q-A')
qc = get_qc('3q-noisy-qvm') # will run on a QVM, but not very meaningfully since there is no cross-talk.
graph = qc.qubit_topology()
edges = list(graph.edges())
edges
[2]:
[(0, 1), (0, 2), (1, 2)]
[3]:
# if you are on the QPU you can look at `qc.device.specs`
# qc.device.specs
Generate CZ Ramsey experiments
[4]:
import numpy as np
from numpy import pi
angles = np.linspace(0, 2*pi, 15)
edge = (0, 1)
# generate a set of len(angles) experiments for each measurement qubit on edge (0, 1).
edge_0_1_expts = [generate_cz_phase_ramsey_experiments(edge, measure_q, angles) for measure_q in edge]
Acquire data
Collect our Ramsey raw data using estimate_observables.
[5]:
from forest.benchmarking.observable_estimation import estimate_observables
# acquire results for each measurement qubit on each edge.
results = []
for angle_expts in zip(*edge_0_1_expts):
    angle_results = []
    for meas_q_expt in angle_expts:
        angle_results += estimate_observables(qc, meas_q_expt, num_shots=500)
    results.append(angle_results)
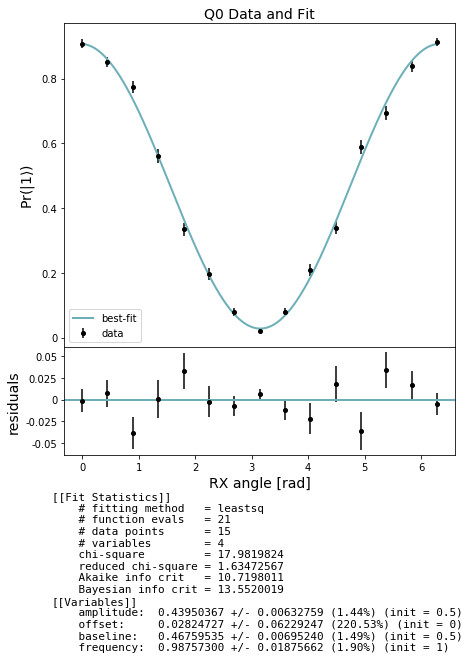
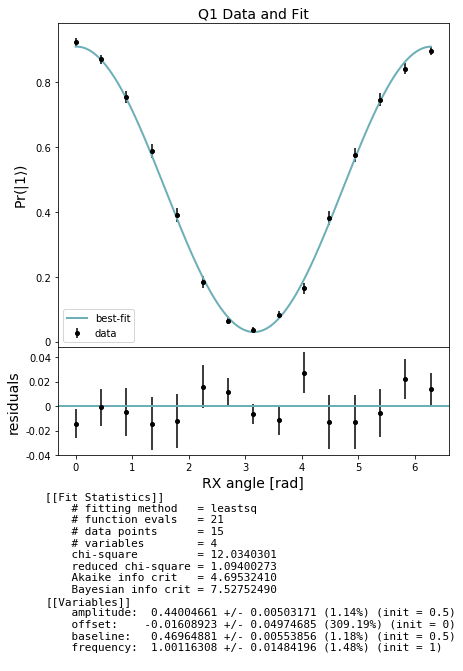
Analyze and plot
Use the results to produce estimates of Ramsey-acquired compensatory RZ phases for this edge
In the cell below we first extract the expectation and std_err for each measurement and store these results in lists separately for each qubit measured. For each qubit measured we then fit a sinusoid to the data from which we can determine the offset of the maximum excited state visibility, which tells us the effective imparted phase. Finally we plot the CZ Ramsey fringes for each qubit with respect to increasing applied contrast phase.
[6]:
from forest.benchmarking.plotting import plot_figure_for_fit

stats_by_qubit = get_stats_by_qubit(results)
for q, stats in stats_by_qubit.items():
    fit = fit_cz_phase_ramsey_results(angles, stats['expectation'], stats['std_err'])
    fig, axs = plot_figure_for_fit(fit, title=f'Q{q} Data and Fit', xlabel="RX angle [rad]",
                           ylabel=r"Pr($|1\rangle$)")
    frequency = fit.params['frequency'].value # ratio of actual angle over intended control angle
    amplitude = fit.params['amplitude'].value # (P(1 given 1) - P(1 given 0)) / 2
    baseline = fit.params['baseline'].value # amplitude + P(1 given 0)
    offset = fit.params['offset'].value # effective imparted phase on the qubit from the CZ, relative to the true qubit frequency
[ ]: