Hinton Plots
Hinton plots show matrix elements visually
Some states
[1]:
import numpy as np
from pyquil.gate_matrices import X, Y, Z
PROJ_ZERO = np.array([[1, 0], [0, 0]])
PROJ_ONE = np.array([[0, 0], [0, 1]])
ID = PROJ_ZERO + PROJ_ONE
PLUS = np.array([[1], [1]]) / np.sqrt(2)
PROJ_PLUS = PLUS @ PLUS.T.conj()
PROJ_MINUS = ID - PROJ_PLUS
Z_EFFECTS = [PROJ_ZERO, PROJ_ONE]
X_EFFECTS = [PROJ_PLUS, PROJ_MINUS]

# Two qubit defs
P00 = np.kron(PROJ_ZERO, PROJ_ZERO)
P01 = np.kron(PROJ_ZERO, PROJ_ONE)
P10 = np.kron(PROJ_ONE, PROJ_ZERO)
P11 = np.kron(PROJ_ONE, PROJ_ONE)
ID_2Q = P00 + P01 + P10 + P11
ZZ_EFFECTS = [P00, P01, P10, P11]
[2]:
from forest.benchmarking.plotting import hinton
from matplotlib import pyplot as plt
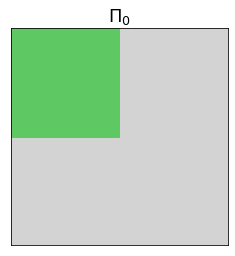
[3]:
hinton(PROJ_ZERO)
_ = plt.title(r'$\Pi_0$', fontsize=18)
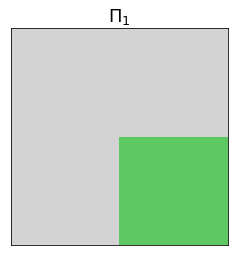
[4]:
hinton(PROJ_ONE)
_ = plt.title(r'$\Pi_1$', fontsize=18)
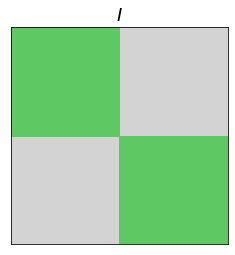
[5]:
hinton(ID)
_ = plt.title(r'$I$', fontsize=18)
[6]:
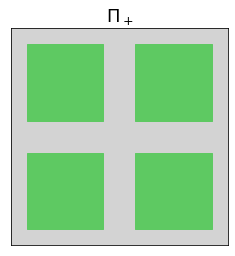
hinton(PROJ_PLUS)
_ = plt.title(r'$\Pi_+$', fontsize=18)
[7]:
hinton(PROJ_MINUS)
_ = plt.title(r'$\Pi_-$', fontsize=18)

[8]:
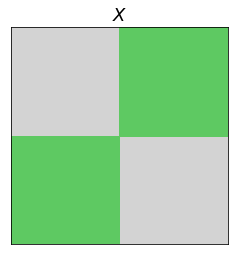
hinton(X)
_ = plt.title(r'$X$', fontsize=18)
[9]:
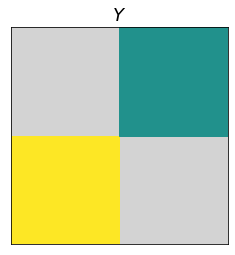
hinton(Y) # this seems wrong
_ = plt.title(r'$Y$', fontsize=18)
[10]:
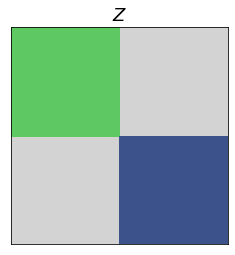
hinton(Z)
_ = plt.title(r'$Z$', fontsize=18)
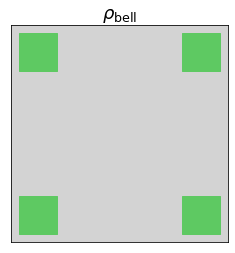
[11]:
bell = 1/np.sqrt(2) * np.array([1, 0, 0, 1])
rho_bell = np.outer(bell, bell)
hinton(rho_bell)
_ = plt.title(r'$\rho_\mathrm{bell}$', fontsize=18)